About Us

Remember when defending public, universal healthcare was a big issue that people talked and cared about? It was front-page news much of the time. We didn’t want American-style for-profit healthcare. We knew out our unique public system was something special…something that helped to define Canada.
Healthcare hasn’t been in the news much lately. In the last Ontario and federal elections, it was hardly mentioned. And because we haven’t been paying attention, public healthcare has suffered.
As our video shows, base operating funding for Ontario’s 149 public hospitals has been frozen for the fourth year in a row, but inflation keeps increasing their costs. As a result, hospitals have been forced to cut services and communities all over Ontario have been hit hard. At the same time, the Ontario Liberals have greatly increased the number of private, for-profit clinics that end up costing us more and eat away at local hospitals’ ability to survive. If you’ve needed hospital care lately, you know how bad it’s getting.
Public Is Better is working to put healthcare back at the top of our government’s agenda. We want Ontario to give healthcare the funding it needs and stop the wasteful privatization of our system.
Facts on Funding
Public Hospital Funding Per Capita
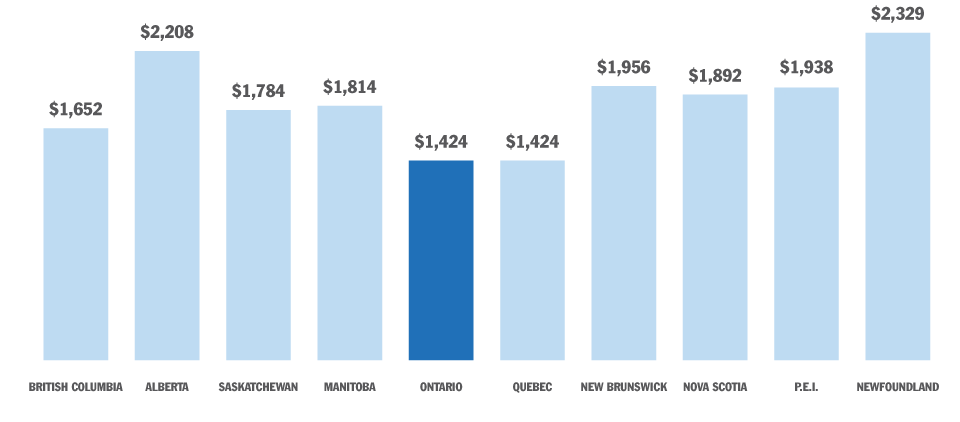
- Ontario ranks last in public hospital funding per person, tied with Quebec and ranks 8th of 10 provinces in hospital funding as a percentage of provincial GDP (Canadian Institute for Health Information, National Health Expenditures Database, 2014)
- In 2015-16 the Ontario health budget rose by 1.2 per cent, well below inflation. Health spending per capita has not recovered in Canada since the 2008 recession, unlike other comparable countries where it has rebounded. Hospital spending has had the lowest rate of growth since the late 1990s (CIHI, National Health Expenditure Trends, 1975 to 2014).
Facts on Overcrowding


- Ontario has one the lowest per capita bed numbers in Canada and across peer countries at a rate of 1.4 acute care hospital beds per 1,000 residents, the lowest level of all province’s except British Columbia, which has 1.3 beds per 1,000 population, (nationally average is 1.7 beds per 1,000 population (CIHI)
- More than 14 per cent of hospital beds are occupied by patients that are waiting for beds in a long term care home. The hospital sector is shrinking and there is enormous pressure to discharge patients faster than ever
- The median wait times for Long Term Care beds have almost tripled from 36 days in 2004/05 fiscal year to 98 days in the 2011/12 fiscal year. An increase in the number of LTC beds of 3% during that period has not kept pace with the rising demand from an aging population. … According to Statistics Canada, between 2012 and 2021, Ontarians aged 75 and older is expected to increase by almost 30%. This trend will likely increase the demand for long-term care (Auditor General Report, 2012)
Facts on Private For-profit Clinics

- In 2014 Ontario brought in regulations making it easier to outsource community hospital services to private, for-profit clinics (Independent Health Facilities).
- These clinics typically take on low-risk, high profit procedures such as cataract and colonoscopy services. This takes a source of revenue away from public hospitals, putting additional pressure on their finances.
- Specialty clinics have charged user fees to patients in contravention to the Canada Health Act (OHC)
The 2012 Auditor General report identified:
- that the Ministry’s X-ray Inspection Services Unit (Unit) had not inspected almost 60% of facilities as frequently as required to ensure that radiation- producing equipment—for example, x-ray equipment—was appropriately shielded to prevent staff and patients from being exposed to excessive radiation levels
- 25 per cent of clinics had irregular billing practices for facility-fee payments for diagnostic services, amounting to increases of 130 % in one instance for ultrasounds charged per limb, going up from $2.9 million in 2007 to $7.5 million in 2011.
- As of March 2012, almost 60% of the independent health facilities had not been assessed within the Unit’s prescribed time frames. Furthermore, the Ministry could not determine how many of these facilities were new or how many had been rated as “bad” in their last inspection.
Facts on Private For-profit Labs

- Laboratory testing was once performed directly in hospitals and in the community in 400 centres
- Ontario now has the fewest lab centres per capita of any province. Since 2008, the number of community laboratory patient care centres dropped by 25%, while the population has grown nearly 20%. Over the past five years, nearly 100 such locations in Ontario have closed. Ontario now has 50 per cent fewer lab centres per capita than BC or Quebec. (Ontario Coalition for Lab Reform)
- Ontario Medical Association (OMA) 2010 survey concluded that: 61 per cent of doctors report that their practice has been affected by closures and reduced hours of service; 81 per cent reported patients who had to travel increased distances due to lab closures; 71 per cent had patients experiencing longer wait times; 45% had patients not going for prescribed testing at all due to excessive waits times
- Sixty per cent of Ontario tests are conducted by private, for-profit labs at a cost of $700 million a year to OHIP.
- Ontario has the highest per capita cost for community lab services in Canada. (BC government study)
- Ontario is the only province not to permit hospitals to conduct laboratory tests for outpatients, posing a significant challenge to many smaller and rural communities underserved by Ontario’s current lab providers
What You Can Do
Visit the Ontario Health Coalition website to
- Write your MPP and the Health Minister
- Learn how to help save your local hospital
- Find out more about healthcare issues in Ontario

Is Your Hospital Code Red?